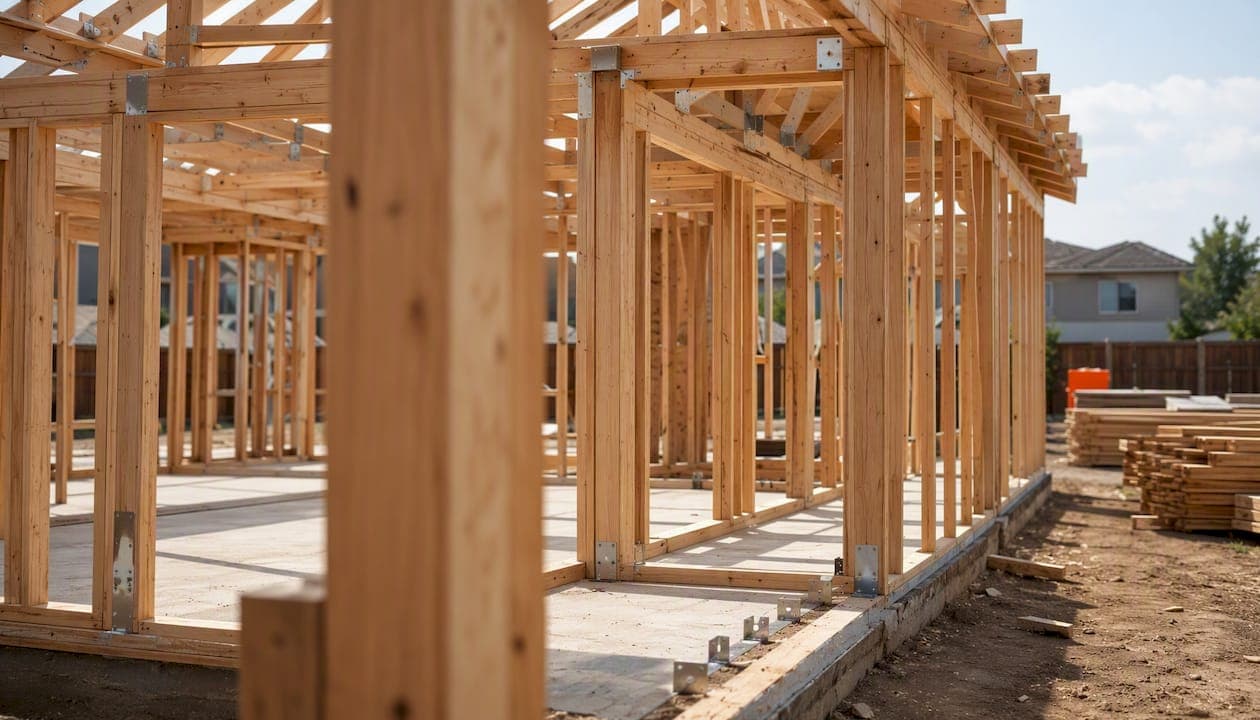
Wind pressure on buildings, formally called wind load in structural engineering, is the distributed force that moving air exerts on a building's surfaces, measured in pounds per square foot (psf) or pascals (Pa). The governing relationship starts with velocity pressure: q = 0.00256 · V² (imperial, standard air density), where V is the basic wind speed in mph. That velocity pressure then becomes a code design pressure through ASCE 7 and IBC wind provisions using the expression p = q · G · Cp − qh · (GCpi), where exposure coefficients, gust factors, and pressure coefficients translate raw air speed into the actual force your structural system must resist.
Three things every practitioner should know before running a single number:
- Code basis: ASCE 7 (currently ASCE 7-22) and the International Building Code (IBC) are the primary U.S. standards. IBC adopts ASCE 7 wind provisions by reference, so they are effectively one system.
- Magnitude context: At a typical moderate basic wind speed used in many U.S. regions, velocity pressure at 30 ft reaches a moderate design range before pressure coefficients are applied. Hurricane-force winds push those numbers substantially higher.
- Scope: Wind pressure governs not just lateral wall loads but also roof uplift, cladding attachment, and the lateral demand on shear walls and diaphragms — the full chain from cladding to foundation.
For residential wood-framed projects, those lateral demands feed directly into shear wall and hold-down sizing. Tools like ShearWise Pro are built specifically to organize those downstream calculations once wind pressures are established.
Key Takeaways
Wind pressure on buildings is governed by ASCE 7's velocity pressure expression and design pressure formula, and the accuracy of every downstream structural check depends on correctly selecting exposure category, enclosure classification, and pressure coefficients before running a single number.
| Point | Details |
|---|---|
| Core formula | Design pressure p = q·G·Cp − qh·(GCpi); velocity pressure qz = 0.00256·Kz·Kzt·Kd·V² (psf). |
| Exposure selection matters | Reclassifying from Exposure B to C can increase design pressures by 30% or more, changing hold-down hardware on every shear wall. |
| MWFRS vs. C&C | Use MWFRS area-averaged loads for shear walls and diaphragms; use higher local C&C pressures for windows, fasteners, and roof panels. |
| Serviceability triggers | Buildings with height-to-width ratio > 4, natural frequency < 1 Hz, or complex geometry require dynamic analysis or wind-tunnel testing beyond static ASCE 7 methods. |
| Stamp required | Final wind load calculations for permit submission must be prepared and stamped by a licensed structural engineer per the current ASCE 7/IBC edition. |
Table of Contents
- What does wind pressure on buildings actually mean?
- How is wind pressure calculated from velocity to design force?
- Which ASCE 7 / IBC method applies to your project?
- How do exposure categories and topography change your wind pressures?
- MWFRS vs. components and cladding: what's the difference?
- When do static wind methods stop being enough?
- How wind pressure drives shear wall design in wood-framed buildings
- Illustrative ASCE 7 wind pressure calculation: step-by-step
- Applying wind pressures in structural design: load path and common pitfalls
- An editorial perspective on wind pressure in practice
- Sources
What does wind pressure on buildings actually mean?
Wind pressure is not a single number. It is a family of actions that differ by surface location, direction, and whether the building envelope is open or closed.
External pressure acts on the building's outer surfaces. On the windward wall, air stacks up and creates a positive (inward) pressure. On leeward walls, side walls, and most roof surfaces, the flow separates and creates negative pressure, commonly called suction. Both act simultaneously, so the net force across a wall or roof panel is the algebraic difference between the two faces.
Internal pressure develops when wind enters through openings — doors, windows, vents, or construction gaps. A building with a dominant opening on the windward side experiences positive internal pressure that adds to the outward push on leeward walls and roof. A dominant leeward opening creates negative internal pressure. ASCE 7 quantifies this with the combined internal pressure coefficient GCpi, which takes values of ±0.18 for enclosed buildings and ±0.55 for partially enclosed buildings.
Uplift on roofs deserves special attention. Wind accelerates over a roof surface, reducing local pressure and creating strong suction. Corner and edge zones routinely see uplift pressures two to three times higher than the field (interior) zone. This is why roof-to-wall connections and sheathing fastening patterns are often the most critical wind details on a low-rise building.
The three design categories practitioners work with are:
- Main wind-force-resisting system (MWFRS): Area-averaged loads applied to the lateral system — shear walls, frames, diaphragms, and foundations.
- Components and cladding (C&C): Local peak pressures applied to individual elements — windows, doors, roof panels, fasteners, and connectors.
- Localized peak pressures: The highest instantaneous pressures at corners, ridges, and eaves, captured by C&C zone maps and relevant to small tributary-area elements.
Units in U.S. practice are psf for design pressures and mph for basic wind speed. SI equivalents (Pa, m/s) appear in research literature and international codes but are not the standard for U.S. permit documents.
How is wind pressure calculated from velocity to design force?
The calculation chain has four steps: select the basic wind speed, compute velocity pressure, apply exposure and topographic adjustments, then multiply by pressure coefficients to get design pressure.
Step 1: Velocity pressure
The fundamental expression is:
q = 0.5 · ρ · V²
For standard sea-level air density (ρ = 0.0765 lb/ft³), this simplifies in imperial units to:
qz = 0.00256 · Kz · Kzt · Kd · V² (psf)
where V is the 3-second gust basic wind speed (mph) from the ASCE 7 wind speed maps. The AIVC wind effects paper notes that reference averaging windows of 10–30 minutes are common in research contexts, but U.S. codes use the 3-second gust as the design reference.
Step 2: Design pressure
The ASCE 7 design pressure expression for most wall and roof surfaces is:
p = qz · G · Cp − qh · (GCpi)
Each symbol carries specific meaning:
As the MDPI paper on code evolution points out, Cp values in codes are statistical estimates derived from wind-tunnel databases. They work well for standard rectangular geometries but can be inadequate for unusual shapes, which is one of the main reasons wind-tunnel calibration exists.
Step 3: Applying the factors in sequence
- Obtain the basic wind speed V from ASCE 7 Figure 26.5-1A/B/C (risk-category-specific maps).
- Determine exposure category (B, C, or D) and read Kz from ASCE 7 Table 26.10-1.
- Check topography; apply Kzt per ASCE 7 Section 26.8 if the site is on or near a hill, ridge, or escarpment.
- Apply Kd = 0.85 for standard buildings.
- Compute qz and qh.
- Select G (0.85 for rigid; dynamic analysis required for flexible buildings with natural frequency < 1 Hz).
- Read Cp from ASCE 7 Figure 27.3-1 (walls) or Figure 27.3-2 (roofs).
- Select GCpi based on enclosure classification.
- Compute p for each surface and zone.
Pro Tip: Always compute both the positive and negative GCpi cases. For enclosed buildings the ±0.18 swing is modest, but for partially enclosed structures the ±0.55 value can flip which load combination governs the roof uplift check.
Practitioner wind load calculators following ASCE 7 automate steps 2 through 9, computing velocity pressure at each height, applying zone Cp values, and producing MWFRS net shears and C&C local pressures ready for shear and overturning checks.
Which ASCE 7 / IBC method applies to your project?
ASCE 7-22 offers five wind load determination procedures. Picking the wrong one is a common source of non-compliance.
- Simplified Directional Procedure (Chapter 27, Part 2): For enclosed, simple diaphragm buildings up to 160 ft, regular plan, and mean roof height ≤ least horizontal dimension. Produces tabulated pressures directly from wind speed and exposure. Fast, but limited to buildings that meet all qualifying conditions.
- Analytical Directional Procedure (Chapter 27, Part 1): The general method for most buildings. Requires computing qz at each height, selecting Cp by zone, and checking enclosure classification. Applies to rigid and flexible buildings.
- Simplified Envelope Procedure (Chapter 28, Part 2): For low-rise enclosed buildings ≤ 60 ft mean roof height with simple diaphragm construction. Uses pseudo-pressure tables that combine external and internal effects.
- Analytical Envelope Procedure (Chapter 28, Part 1): For low-rise buildings where the simplified envelope tables don't apply. Uses GCpf values from ASCE 7 Figure 28.3-1.
- Wind-Tunnel Procedure (Chapter 31): Permitted for any building; required when geometry falls outside the scope of the analytical methods or when serviceability demands more precision.
Quick applicability screening:
- Height > 160 ft: Directional analytical only (or wind tunnel).
- Height-to-width ratio > 4 or natural frequency < 1 Hz: Flexible building; dynamic gust factor required.
- Irregular plan, significant setbacks, or complex roof geometry: Analytical or wind tunnel; simplified tables do not apply.
- Essential facilities or critical serviceability requirements: Consider wind tunnel even when analytical methods are technically permitted.
The ATC-60 Wind Commentary provides worked examples and practical guidance for applying these procedures, including commentary on internal pressure classification and effective wind area definitions that the code text alone does not fully resolve.
Pro Tip: *Before committing to a method, verify the building's fundamental natural frequency. A 10-story concrete building may be rigid; a 10-story light steel frame may not be.
How do exposure categories and topography change your wind pressures?
Exposure category is one of the highest-leverage decisions in a wind load calculation.
Exposure B: Urban and suburban areas, wooded terrain, or other terrain with closely spaced obstructions at least 30 ft tall. Applies when the site has at least 1,500 ft of such terrain upwind in the governing wind direction. Most residential subdivisions qualify — but only when the upwind fetch is genuinely dense.
Exposure C: Open terrain with scattered obstructions less than 30 ft tall. Flat open country, grasslands, and all cases where Exposure B or D does not apply. This is the default when in doubt.
Exposure D: Flat, unobstructed areas exposed to wind flowing over open water for at least 5,000 ft or 20 times the building height, whichever is greater. Coastal sites and lakefronts often fall here.
A common mistake is assigning Exposure B to a suburban site without checking all wind directions. ASCE 7 requires you to evaluate the upwind fetch for each wind direction that could govern. A house on the edge of a subdivision facing an open field to the west may be Exposure C for westerly winds even if it is Exposure B for easterly winds.
Topographic factor Kzt: Apply when the site is on or near a hill, ridge, or escarpment with a height-to-half-width ratio ≥ 0.2 and the structure sits within 1.5 times the feature height of the crest. Kzt amplifies velocity pressure and can exceed 1.5 on steep ridges. Screening is straightforward: if the site is flat or the feature is small relative to the building setback, Kzt = 1.0.
Importance factor Ie: ASCE 7 ties wind loads to risk category. Risk Category II (most commercial and residential buildings) uses the standard wind speed map. Risk Category III and IV structures (schools, hospitals, essential facilities) use higher wind speed maps that effectively increase design loads. The ASCE 7 prerequisites checklist lists exposure category, basic wind speed, Kz, Kzt, wind direction, and building type as required inputs before any calculation begins.
On-the-job checklist for exposure and topography:
- Confirm the site's upwind fetch in all governing wind directions (aerial imagery helps).
- Check whether any adjacent open water, open fields, or terrain breaks push the category from B to C.
- Screen for topographic features within 1.5H of the crest.
- Confirm the risk category from the project's occupancy classification.
- Document all selections in the calculation package — reviewers will check them.
MWFRS vs. components and cladding: what's the difference?
These two design categories use different pressure values for a reason. The MWFRS resists the total lateral and uplift force on the building as a whole; C&C elements resist local peak pressures on small areas. Conflating them is one of the most common wind-load errors in practice.
MWFRS loads are area-averaged. When wind pushes on a 40-ft-wide wall, the pressure varies across the surface, but the structural frame sees a resultant that averages out local peaks. MWFRS pressures are used to size shear walls, moment frames, diaphragms, collectors, and foundations.
C&C loads are local. A 2-ft² window corner experiences a higher instantaneous pressure than the 40-ft wall average because turbulence concentrates at edges and corners. C&C pressures apply to individual fasteners, window frames, roof panels, and cladding attachments. They are always larger than MWFRS pressures for the same zone, sometimes by a factor of two or more.
| Design category | Tributary area | Pressure magnitude | Typical application |
|---|---|---|---|
| MWFRS | Full wall or roof panel | Lower (area-averaged) | Shear walls, diaphragms, frames, foundations |
| C&C | Individual element (≤ 400 ft² effective wind area) | Higher (local peak) | Windows, doors, roof sheathing, fasteners, connectors |
Building pressure zones define where local peaks occur. ASCE 7 divides walls and roofs into corner, edge, and field (interior) zones. Corner zones carry the highest C&C pressures; field zones carry the lowest. For a typical low-rise building:
- Roof corner zones (Zone 3): Highest uplift, often 1.5–2× the field zone value.
- Roof edge zones (Zone 2): Intermediate uplift.
- Roof field zone (Zone 1): Lowest uplift, but still governs sheathing nailing in many cases.
The ATC-60 Wind Commentary includes practical guidance on effective wind area, which determines which zone pressure to use when an element's tributary area spans multiple zones.
Checklist for reviewing C&C vs. MWFRS outputs:
- Confirm that shear wall and diaphragm design used MWFRS pressures, not C&C values.
- Confirm that window, door, and roof panel design used C&C pressures for the correct zone.
- Verify that enclosure classification (enclosed vs. partially enclosed) is consistent between MWFRS and C&C calculations.
- Check that corner zone dimensions were computed correctly (typically 10% of the least horizontal dimension or 40% of the mean roof height, whichever is smaller, per ASCE 7).
When do static wind methods stop being enough?
Static methods work well for most low-rise and mid-rise buildings. They break down when the building's dynamic behavior starts to interact with the wind's turbulence structure — and the consequences of missing that interaction range from occupant discomfort to non-structural damage to, in extreme cases, fatigue failure.
Serviceability issues appear before strength limits. Plaster cracking, partition damage, and accelerated facade sealant fatigue often occur at wind loads well below the design ultimate level. The AIVC wind effects paper notes that repeated dynamic loading and amplification produce serviceability problems — including plaster cracking and accelerated settlement — long before structural strength limits are reached. Screening checks should include natural frequency and damping estimates.
Dynamic effects to watch for:
- Along-wind buffeting: Turbulence in the approaching flow causes fluctuating drag. Captured by the gust factor G in ASCE 7, but only for rigid buildings.
- Across-wind response: Vortex shedding and wake turbulence drive oscillations perpendicular to the wind. Not captured by standard ASCE 7 static methods. Critical for slender towers and tall residential buildings.
- Vortex shedding: Periodic shedding of vortices creates oscillating lift forces. Risk increases when the building's natural frequency is close to the shedding frequency.
- Torsional response: Asymmetric plan shapes or non-uniform stiffness distributions create twisting under wind that static methods underestimate.
Research comparing code calculations with computational wind-tunnel (CWT) predictions found that analytical methods tend to be conservative for mean loads but that surrounding buildings can reduce mean loads while increasing fluctuating loads — the fluctuating component being the one that drives serviceability and occupant comfort concerns.
Pro Tip: Occupant comfort thresholds for building acceleration are typically expressed as peak acceleration in milli-g (mg). A commonly referenced threshold for office occupancy is around 10–15 mg for a 1-year return period wind event. If your building is slender and lightly damped, run a preliminary acceleration estimate before finalizing the structural system.
Trigger checklist for escalating to dynamic analysis or wind-tunnel testing:
- Building height-to-width ratio > 4 or height > 400 ft.
- Natural frequency < 1 Hz (flexible building per ASCE 7 definition).
- Unusual plan geometry, significant setbacks, or complex roof profile.
- Site in complex terrain with channeling or shielding from adjacent structures.
- Critical occupancy with strict serviceability requirements (hospitals, laboratories, high-end residential).
- Facade system with tight deflection tolerances or brittle cladding materials.
How wind pressure drives shear wall design in wood-framed buildings
For 1- and 2-story wood-framed residential buildings, wind pressure is the starting point for every lateral design check. The MWFRS lateral loads derived from the wind pressure calculation get distributed to shear walls through the diaphragm, and those shear walls must be sized, detailed, and connected to resist both the in-plane shear and the overturning moment.
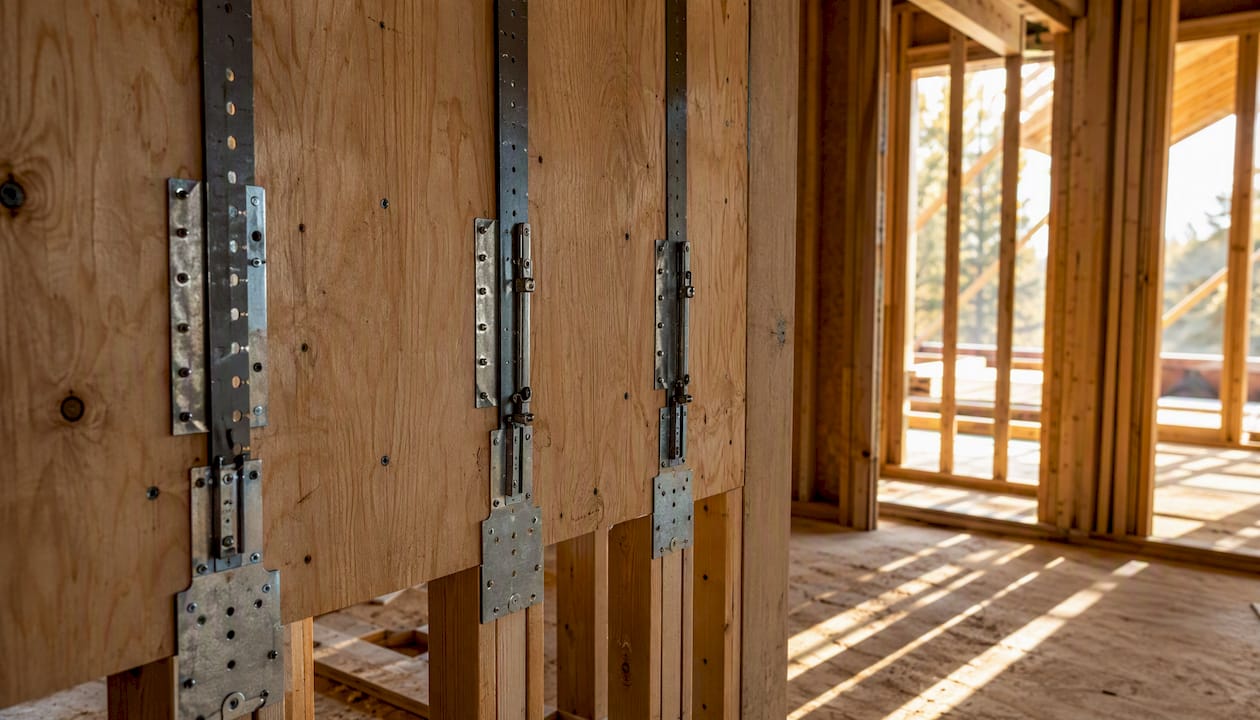
The load path runs: wind pressure on cladding → tributary load to diaphragm → diaphragm distributes to shear wall lines → shear walls transfer to foundation via hold-downs and sill plate connections. Every interface in that chain needs a capacity check.
Common residential features that raise wind demand:
- Large garage openings or window walls: Reduce the available full-height shear wall length, concentrating demand on fewer segments and increasing hold-down forces.
- Parapets: Add a moment arm above the roof diaphragm, increasing the overturning demand on the top story.
- Steep roofs: Increase the windward roof pressure coefficient and the projected vertical area, raising both lateral and uplift loads.
- Irregular plan shapes: Create re-entrant corners and torsional eccentricity that simple tributary-area methods can underestimate.
- Partially enclosed conditions: A large garage door left open during a storm shifts the building to partially enclosed, raising GCpi from ±0.18 to ±0.55 and significantly increasing net roof uplift.
For a permit-ready wood-frame lateral analysis, the calculation package should include:
- Exposure category selection with upwind fetch documentation.
- Basic wind speed from the correct risk-category map.
- MWFRS lateral loads by story and wall line.
- Shear wall schedule with unit shear, panel grade, nailing, and hold-down hardware.
- Story drift check (ASCE 7 / IBC drift limits apply to wind as well as seismic).
- Connection capacities at sill plates, top plates, and hold-down anchors.
Reviewing lateral load distribution across wall lines requires tracking tributary widths, diaphragm flexibility assumptions, and whether the structure qualifies for the simplified rigid or flexible diaphragm rules. Getting those assumptions wrong changes which walls carry the most load.
Illustrative ASCE 7 wind pressure calculation: step-by-step
The following is an illustrative walkthrough only. It does not substitute for a code-compliant calculation prepared and stamped by a licensed structural engineer using the current ASCE 7/IBC edition and any locally adopted amendments.
Scenario: Single-story rectangular office building, 40 ft × 60 ft plan, 15 ft mean roof height, flat roof, enclosed, Risk Category II, Exposure C, basic wind speed V = 115 mph, flat terrain (Kzt = 1.0).
-
Basic wind speed: V = 115 mph (from ASCE 7 Figure 26.5-1B for Risk Category II).
-
Velocity pressure at mean roof height (h = 15 ft):
- Kz at 15 ft, Exposure C = 0.85 (ASCE 7 Table 26.10-1)
- Kzt = 1.0 (flat terrain)
- Kd = 0.85 (standard building)
- qh = 0.00256 × 0.85 × 1.0 × 0.85 × 115² = 0.00256 × 0.85 × 0.85 × 13,225 ≈ 24.5 psf
-
Gust factor: G = 0.85 (rigid building, natural frequency > 1 Hz).
-
External pressure coefficients (ASCE 7 Figure 27.3-1, L/B = 60/40 = 1.5):
- Windward wall: Cp = +0.8
- Leeward wall: Cp = −0.5
- Side walls: Cp = −0.7
-
Internal pressure coefficient: GCpi = ±0.18 (enclosed building).
-
Design pressures (MWFRS):
Note: Windward wall p = qh·G·Cp − qh·(GCpi) = 24.5 × 0.85 × 0.8 − 24.5 × (−0.18) = 16.7 + 4.4 = 21.1 psf. Leeward: 24.5 × 0.85 × (−0.5) − 24.5 × (+0.18) = −10.4 − 4.4 = −14.8 psf.
-
Net lateral pressure (windward + leeward combined): 21.1 + 14.8 = 35.9 psf on the 40-ft face.
-
Total base shear (40-ft direction): 35.9 psf × 15 ft × 40 ft = 21,540 lb ≈ 21.5 kips (to be distributed to shear walls along the 40-ft face).
Practitioner ASCE 7 wind load calculators replicate this arithmetic for all zones simultaneously and produce MWFRS net shears and overturning moments in one pass.
Applying wind pressures in structural design: load path and common pitfalls
Calculated pressures are only useful when they are correctly traced through the structure to every resisting element. The load path from cladding to foundation has several interfaces, and each one is a potential failure point in both the structure and the calculation.
Load path summary:
- Cladding → C&C elements: Window frames, wall panels, and roof sheathing resist local C&C pressures. Fastener capacity and panel bending govern here.
- C&C → MWFRS: Diaphragm collects tributary wind load from the wall and roof surfaces and transfers it as a shear to the lateral system.
- MWFRS → foundation: Shear walls carry in-plane shear to the foundation; hold-downs resist overturning; sill plate anchors resist sliding.
Common mistakes that show up in design reviews:
- Wrong tributary areas for C&C: Using the full wall area instead of the effective wind area for a single fastener or panel. C&C pressures decrease as effective wind area increases — using the wrong area can over- or under-design the connection.
- Inconsistent enclosure classification: Calling the building enclosed for MWFRS but not adjusting GCpi for a large unprotected opening on the windward face.
- Ignoring local peak pressures at corners: Applying field-zone C&C pressures to corner-zone elements. Corner pressures can be 50–100% higher.
- Missing the directionality check: Assuming the governing wind direction is always perpendicular to the longest face. For non-rectangular plans, oblique wind directions can produce higher net shears.
- Skipping story drift under wind: IBC requires drift checks under wind as well as seismic. Wood-framed buildings with long, open wall lines can exceed drift limits under wind even when shear capacity is adequate.
Practical next steps for designers and reviewers:
- Run a peer check on exposure category and enclosure classification before finalizing pressures.
- If the building triggers any of the dynamic analysis criteria listed in the serviceability section, engage a wind specialist early — retrofitting the structural system after design development is expensive.
- Use lateral design software to organize wall line assignments, tributary areas, and hold-down forces in a format that reviewers and permit offices can follow.
- For projects near the wind-tunnel trigger thresholds, a preliminary CWT study costs far less than redesigning cladding systems after construction.
- Document every assumption — exposure category, enclosure classification, Kzt screening, and risk category — in the calculation package. Reviewers will flag any that are missing.
An editorial perspective on wind pressure in practice
The most persistent problem in wind load design is not the math. The equations are straightforward once you have the inputs. The problem is that the inputs — exposure category, enclosure classification, and topographic factor — require judgment, and that judgment is often made too quickly.
Exposure category is the clearest example. Many residential projects default to Exposure B because the neighborhood looks suburban. But ASCE 7's definition requires a specific upwind fetch of dense terrain, and a house on the edge of a development, facing an open field or a parking lot, may be Exposure C in the governing wind direction.
Enclosure classification is the second common shortcut. Designers classify a building as enclosed, apply GCpi = ±0.18, and move on. But a large garage door or a covered porch with open sides can push the building into partially enclosed territory, where GCpi = ±0.55. The difference in roof uplift is not trivial, particularly on low-slope roofs where the net uplift already challenges standard rafter-to-plate connections.
The deeper issue is that wind load calculations are often treated as a box to check rather than a design driver. The numbers that come out of the wind pressure calculation set the demand for every lateral element in the building. Getting them right at the start saves time at every downstream step — shear wall sizing, hold-down selection, connection detailing, and permit review. Getting them wrong means revisions at every one of those steps.
For residential wood-framed projects, the practical answer is to slow down at the input stage, document every selection, and use a structured calculation workflow that makes the assumptions visible. That is exactly the kind of organized, reviewable output that tools like ShearWise Pro are built to support.
Sources
The sources below are the primary references for wind pressure calculation and code compliance in U.S. practice.
- Wind effects (AIVC paper)
- Wind loading on high-rise buildings and the comfort effects on the occupants
- Code evolution and limitations in wind-induced pressures (MDPI paper)
- ATC-60 Wind Commentary (SEAW/ATC)